Friday, September 28, 2012

Hot Issue: Bushfires, Powerlines and Climate Change

English: Lake Mountain toboggan run after 2009...
2009 Black Saturday bushfires (Wikipedia)
by Professor David Bowman, Professor, Environmental Change Biology at University of Tasmania, The Conversation: http://theconversation.edu.au

We have unwittingly hardwired a bushfire ignition source throughout our flammable landscapes - powerlines.

Powerlines can fail under any conditions but the risk increases on days of high bushfire risk, which means powerline failures frequently start bushfires.

The problem was clearly identified by the 2009 Black Saturday Victorian Bushfire Royal Commission. The Director of Energy Safe Victoria told the Commission it was “probably self-evident” that there was an increased chance of fires caused by electrical assets on days of extreme fire danger.

The Bushfire Royal Commission found that on 7 February 2009, electrical faults caused five of the 11 major fires.

This significant risk led the Royal Commission to make a number of recommendations. These are now being acted on as part of the Victorian Government’s Powerline Bushfire Safety Program. More than $750 million is being invested in new safety measures for Victoria’s electricity grid. Changes include improved maintenance of existing infrastructure and roll out of technology to target high risk areas.

This requires approximately $500 million in improvements to protection and controls on Victoria’s electricity network. These “will be funded by electricity distributors and will be recovered at a modest increase in power bills to customers.” The Victorian Government will “provide up to $200 million for the replacement of powerlines in areas of highest bushfire risk over the next eight years”.

There will be an additional $40 million Safer Electricity Assets Fund “to address equity and financial hardship issues associated with bushfire mitigation”. Ten million dollars will be provided “to fund research to improve the cost effectiveness of bushfire mitigation”.

A key change in existing infrastructure is the modification of automatic circuit breakers. The current generation of circuit breakers has been shown to cause bushfires by sparking when attempting to reconnect power. However modifications to remedy this fault may result in blackouts on days of high bushfire risk.

Bushfire ignition by power line faults has a serious legal dimension. Powercor paid Horsham residents and businesses $40 million to settle a class action after the Black Saturday bushfires.

The electricity provider SP AusNet paid $19.7 million to settle a class action over the Beechworth fire that also occurred on Black Saturday. The company is contesting other class actions relating to other Black Saturday bushfires, all allegedly caused by electrical faults.

To read further, go to: http://theconversation.edu.au/hot-issue-bushfires-powerlines-and-climate-change-9383?utm_medium=email&utm_campaign=Latest+from+The+Conversation+for+28+September+2012&utm_content=Latest+from+The+Conversation+for+28+September+2012+CID_520d73d31187ad369db5fe46f1f171e6&utm_source=campaign_monitor&utm_term=Hot%20issue%20-%20bushfires%20powerlines%20and%20climate%20change
Enhanced by Zemanta

Friday, September 21, 2012

The Atmosphere’s Shift of State and the Origin of Extreme Weather Events

Greenhouse Gases
Greenhouse Gases (Photo: CECAR)
by Professor Andrew Glikson, Earth and paleo-climate scientist at Australian National University, The Conversation: theconversation.edu.au

The linear nature of global warming trends projected by the IPCC since 1990 and as late as 2007 (see Figure 1) has given the public and policy makers an impression there is plenty of time for economies to convert from carbon-emitting industries to non-polluting utilities.

Paleo-climate records suggest otherwise. They display abrupt shifts in the atmosphere/ocean/cryosphere system, as manifest in the ice core records of the last 800,000 years.

This suggests high sensitivity of the climate system to moderate changes in radiative forcing, whether triggered by changes in solar radiation energy or the thermal properties of greenhouse gases or aerosols. In some instances these shifts have happened over periods as short as centuries to decades, and even over a few years.

Figure 1: Global surface temperature rise trajectories for the 21st century under varying carbon emission scenarios portrayed by the IPCC AR4 2007. A2 represents the business-as-usual scenario consistent with currently rising global emissions. IPCC
Examples of abrupt climate shifts are the 1470 years-long Dansgaard-Oeschger intra-glacial cycles, which were triggered by solar signals amplified by ocean currents, and the “younger dryas” cold interval, which occured when interglacial peaks resulted in extensive melting of ice and cooling of large ocean regions by melt water.

The last glacial termination (when large-scale melting of ice occurred between about 18,000 to 11,000 years ago) is attributed to transient solar pulsations of 40–60 Watt/m2 affecting mid-northern latitudes. This led to a ~6.5+/-1.5 Watt/m2 rise in mean global atmospheric energy level, which meant a mean global temperature rise of ~5.0+/-1.0 degrees Celsius and sea level rise of 120 meters (see Figure 2).

Figure 2: Comparison between radiative forcing levels of (1) the Pliocene (~400 ppm CO2; T ~ 2-3 degrees C; Sea level 25+/-12 meters higher than pre-industrial); (2) the last Glacial Termination (~6.5+/-1.5 Watt/m2; ~5.0+/-1.0 degrees C; SL rise 120 meters) and (3) Anthropogenic 1750-2007 warming (1.66 Watt/m2 + 1.35 Watt/m2 – the latter currently masked by sulphur aerosols). Modified after Hansen et al 2008
As shown in Figure 2, anthropogenic carbon emission and land clearing since 1750 have raised the atmospheric energy level by +1.66 Watt/m2. Once the masking effect of industrial sulphur aerosols is taken into account. This totals ~3.0 Watt/m2, namely near half the radiative forcing associated with the last glacial termination.

Compounding the major rise in radiative forcing over the last ~260 years is the rate of greenhouse gas (GHG) rise. This has averaged ~0.5ppm CO2 per year since 1750. That’s more than 40 times the rate during the last glacial termination, which was 0.012ppm CO2 per year. The current CO2 rise rate - 2ppm a year - is the fastest recorded for the Cainozoic (the period since 65 million years ago) (see Figure 3).

Figure 3: Relations between CO2 rise rates and mean global temperature rise rates during warming periods, including the Paleocene-Eocene Thermal Maximum, Oligocene, Miocene, glacial terminations, Dansgaard-Oeschger (D-O) cycles and the post-1750 period. Glikson
We have seen this scale and rate of radiative forcing, in particular since the 1970s, expressed by intensification of the hydrological cycle, heat waves and hurricanes around the globe. It imparts a new meaning to the otherwise little-defined term, “tipping point”.

Between 1900 and 2000, the ratio of observed to expected extremes in monthly mean temperatures has risen from ~1.0 to ~3.5. From about 1970 the Power Dissipation Index (which combines storm intensity, duration, and frequency) of North Atlantic storms increased from ~1.0 to ~2.7-5.5 in accord with tropical sea surface temperatures which rose by about 1.0 degree Celsius.

To read further, go to: http://theconversation.edu.au/the-atmospheres-shift-of-state-and-the-origin-of-extreme-weather-events-9285?utm_medium=email&utm_campaign=Latest+from+The+Conversation+for+21+September+2012&utm_content=Latest+from+The+Conversation+for+21+September+2012+CID_a2ddc53ba21a589e6421534d4781482b&utm_source=campaign_monitor&utm_term=The%20atmospheres%20shift%20of%20state%20and%20the%20origin%20of%20extreme%20weather%20events
Enhanced by Zemanta

Friday, September 14, 2012

Queensland’s Big Step Back From Environmental Assessment

English: Professor Ian Lowe making a presentat...
Professor Ian Lowe (Photo: Wikipedia)
by Emeritus Professor Ian Lowe, Emeritus Professor, School of Science at Griffith University, The Conversation: http://theconversation.edu.au

The defining characteristic of the Newman government’s environmental policy seems to be a Great Leap Backwards: an old-fashioned determination not to let environmental concerns get in the way of expanding the mining industry in general and the coal industry in particular. It really is a coal-ition government.

There were early signs in such penny-pinching measures as scrapping the public funding of the Environmental Defenders’ Office, which provides legal advice to individuals and community groups when they are resisting inappropriate developments.

Wriggling out of the previous government’s commitment to support large scale solar energy projects, then cutting the feed-in tariff so that householders who install solar panels in future will actually be subsidising electricity retailers, were further signs of a mindset harking back to the fossil-fuel age.

The real worry is the approach to environmental assessment more generally. No objective observer could possibly conclude that industry is currently over-regulated in Queensland.

It has recently experienced specific environmental problems: devastation of fishing in the Gladstone area, methane coming to the surface near coal-seam gas operations. More generally, four national state-of-the-environment reports have documented the steady and systematic worsening of all the major environmental indicators, including the loss of our unique biological diversity.

Yet the first time Mr Newman met with his fellow coalition Premiers, he joined them in calling for the elimination of “green tape”: what they perceive to be needless restrictions on business interests who want to ignore environmental harm to maximise profits.

Then Newman attacked the federal environment minister, claiming that he was causing needless delays to resource projects in Queensland, when he delayed the massive Alpha coal mine because of the inadequacies in the State-based environmental impact assessment.

As I was preparing this piece, the government announced dramatic cuts to the public service in the natural resources area, claiming that “over-regulation” was holding back development and costing the tax-payer money to no good end.

The public face of this change was the rapid passage in July of the Environmental Protection (Greentape Reduction) and Other Legislation Amendments Bill. The Minister said the emphasis is on “streamlining and clarifying assessment and approval processes”, promising “benefits and savings” for “all regulated activities”.

The government claimed there would be no erosion of environmental standards. To be fair, standards in Queensland were not particularly high when the government changed.

Under the previous Bligh government, the environment department generally seemed to see its job as ensuring that no environmental concerns impeded a profitable proposal.

To read further, go to: http://theconversation.edu.au/queenslands-big-step-back-from-environmental-assessment-9238?utm_medium=email&utm_campaign=Latest+from+The+Conversation+for+14+September+2012&utm_content=Latest+from+The+Conversation+for+14+September+2012+CID_c5cae4bcd39c0886e55d95a24bc2a36e&utm_source=campaign_monitor&utm_term=Queenslands+big+step+back+from+environmental+assessment
Enhanced by Zemanta

Saturday, September 8, 2012

Louisiana Looks for 'Smoking Gun' to Link Isaac Tar Balls to Gulf Oil Disaster

by , US environment correspondent, The Guardian, http://www.guardian.co.uk

Officials report weathered oil in areas struck by the hurricane that also were badly damaged after the Deepwater Horizon spill.

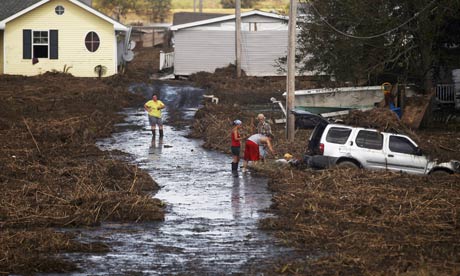
Hurricane Isaace in Braithwaite, Louisiana
Braithwaite, Louisiana, experienced a chemical release in the aftermath of hurricane Isaac. Photograph: Mario Tama/Getty Images

Louisiana is investigating whether tar balls deposited on Gulf of Mexico beaches by Hurricane Isaac were relics of the 2010 BP oil disaster.

Government agencies and environmental groups this week reported weathered oil in areas which took the brunt of last week's hurricane - and which were also heavily damaged by the 4.9m barrel gusher from BP's leaking oil well.

"I'd say there is a smoking gun," Garrett Graves, the coastal adviser to Louisiana's governor Bobby Jindal, told news organisations. "It's an area that experienced heavy oiling during the spill."

State officials shut down commercial fishing and all shrimping in a 13-mile stretch from Port Fourchon to Caminada Pass, after observing tar mats and high concentration of tar balls on beaches.

The Gulf Restoration Network, which has been touring the aftermath of Isaac by air and boat this week, said crew had reported 109 dead pelican in the wake of the storm and oil in a number of locations on the Louisiana and Mississippi coasts.

"We saw a fair amount of oil sheen and fresh tar balls at Ship Island, one of the Mississippi barrier islands," said Aaron Viles, a spokesman for the coalition of environmental groups. "The storm really delivered a shock to the ecosystem, and we are seeing BP oil showing up again and we are seeing, unfortunately, real impacts to an ecosystem still struggling to recover."

The Gulf network had repeatedly warned that powerful storms risked dredging up oil that had been purposely sunk to the ocean floor, by the use of chemical dispersants in the wake of the BP oil spill.

To read further, go to: http://www.guardian.co.uk/environment/2012/sep/05/louisana-isaac-tar-gulf-oil?INTCMP=SRCH

Saturday, September 1, 2012

Arctic Ice Shatters Melt Record

by , Mother Jones: http://www.motherjones.com/blue-marble/2012/08/arctic-ice-shatters-melt-record

Arctic sea ice on Aug. 26, 2012, the day the sea ice dipped to its smallest extent ever recorded in more than three decades of satellite measurements: Scientific Visualization Studio, NASA Goddard Space Flight Center
Arctic sea ice on August 26, the day the sea ice dipped to its smallest extent ever recorded in more than three decades of satellite measurements Scientific Visualization Studio, NASA Goddard Space Flight Center
The Arctic sea ice extent yesterday fell below its previous record low and is currently losing frozen sea at the rate of about 29,000 square miles (roughly 75,000 square kilometers) a day. That's equivalent to an area the size of South Carolina every 24 hours.

Here's what happened:
  • On August 26 sea ice extent fell to 1.58 million square miles (4.10 million square kilometers).
  • That's 27,000 square miles (70,000 square kilometers) below the previous record set on September 18, 2007.
  • The 2007 record low ice extent was 1.61 million square miles (4.17 million square kilometers).
Note that this year's record low was set more than three weeks earlier than the 2007 record. And summer isn't over yet. There's more melting to come.
Arctic sea ice extent as of August 26, 2012, along with daily ice extent data for 2007, the previous record low year, and 1980, the record high year: National Snow and Ice Data Center courtesy Rutgers University Snow Lab.
Arctic sea ice extent as of August 26, along with daily ice extent data for 2007, the previous record low year, and 1980, the record high year: National Snow and Ice Data Center courtesy Rutgers University Snow Lab.
What's alarming is that the 2007 record was set during a year of near-perfect conditions for melting. This year didn't have anything like perfect conditions. But even that couldn't stop the freight train running down those Arctic tracks.

According to National Snow and Ice Data Center (NSIDC) Director Mark Serreze: "The ice is so thin and weak now, it doesn't matter how the winds blow."

The six lowest ice extents in the satellite record have occurred in the last six years, from 2007 to 2012.

This trend is an indication that the Arctic sea ice cover is fundamentally changing, said NSIDC scientist Walt Meier. "The Arctic used to be dominated by multiyear ice, or ice that stayed around for several years. Now it's becoming more of a seasonal ice cover and large areas are now prone to melting out in summer."

Scattered ice floes are seen from the bridge of the RV Healy on August 20, 2012 northwest of Barrow, Alaska: US Coast Guard
Scattered ice floes seen from the bridge of US Coast Guard icebreaker Healy on August 20, northwest of Barrow, Alaska: US Coast Guard.

The photo above shows the view from the US Coast Guard icebreaker Healy, a science research ship that runs north looking for ice. They've been having problems finding it the last few summers.

BTW, I'm headed out aboard Healy for their last Arctic run of the year in October. I'll let you know what I see up there. And what that might mean for the people and wildlife of the Arctic. Not to mention all the rest of us who've kind of gotten used to the effects of its frozenness on the planet.